Q-upNavi
Monitor and Better Understand your Inspection Data to Improve Productivity
Are you spending a lot of time on quality analysis in your daily production? You can quickly and easily find out the quality improvement points that need to be started immediately from the current production status.
- Q-up Auto maintains high quality and high productivity autonomously in your production line.
- Immediately identify your line, model, process, and status of the problem.
- Determine whether you should start work immediately and what you need to do.
- Effects of Q-upAuto/I are time-saving in analysis, Increased inspection efficiency and Reduction of waste time on visual inspection.
How can we help you?
If you have a question, please contact us or send a request.
Contact me Q-upNavi
Thank you for submitting your request. We will come back to you as soon as possible.
We are experiencing technical difficulties. Your form submission has not been successful. Please accept our apologies and try again later. Details: [details]
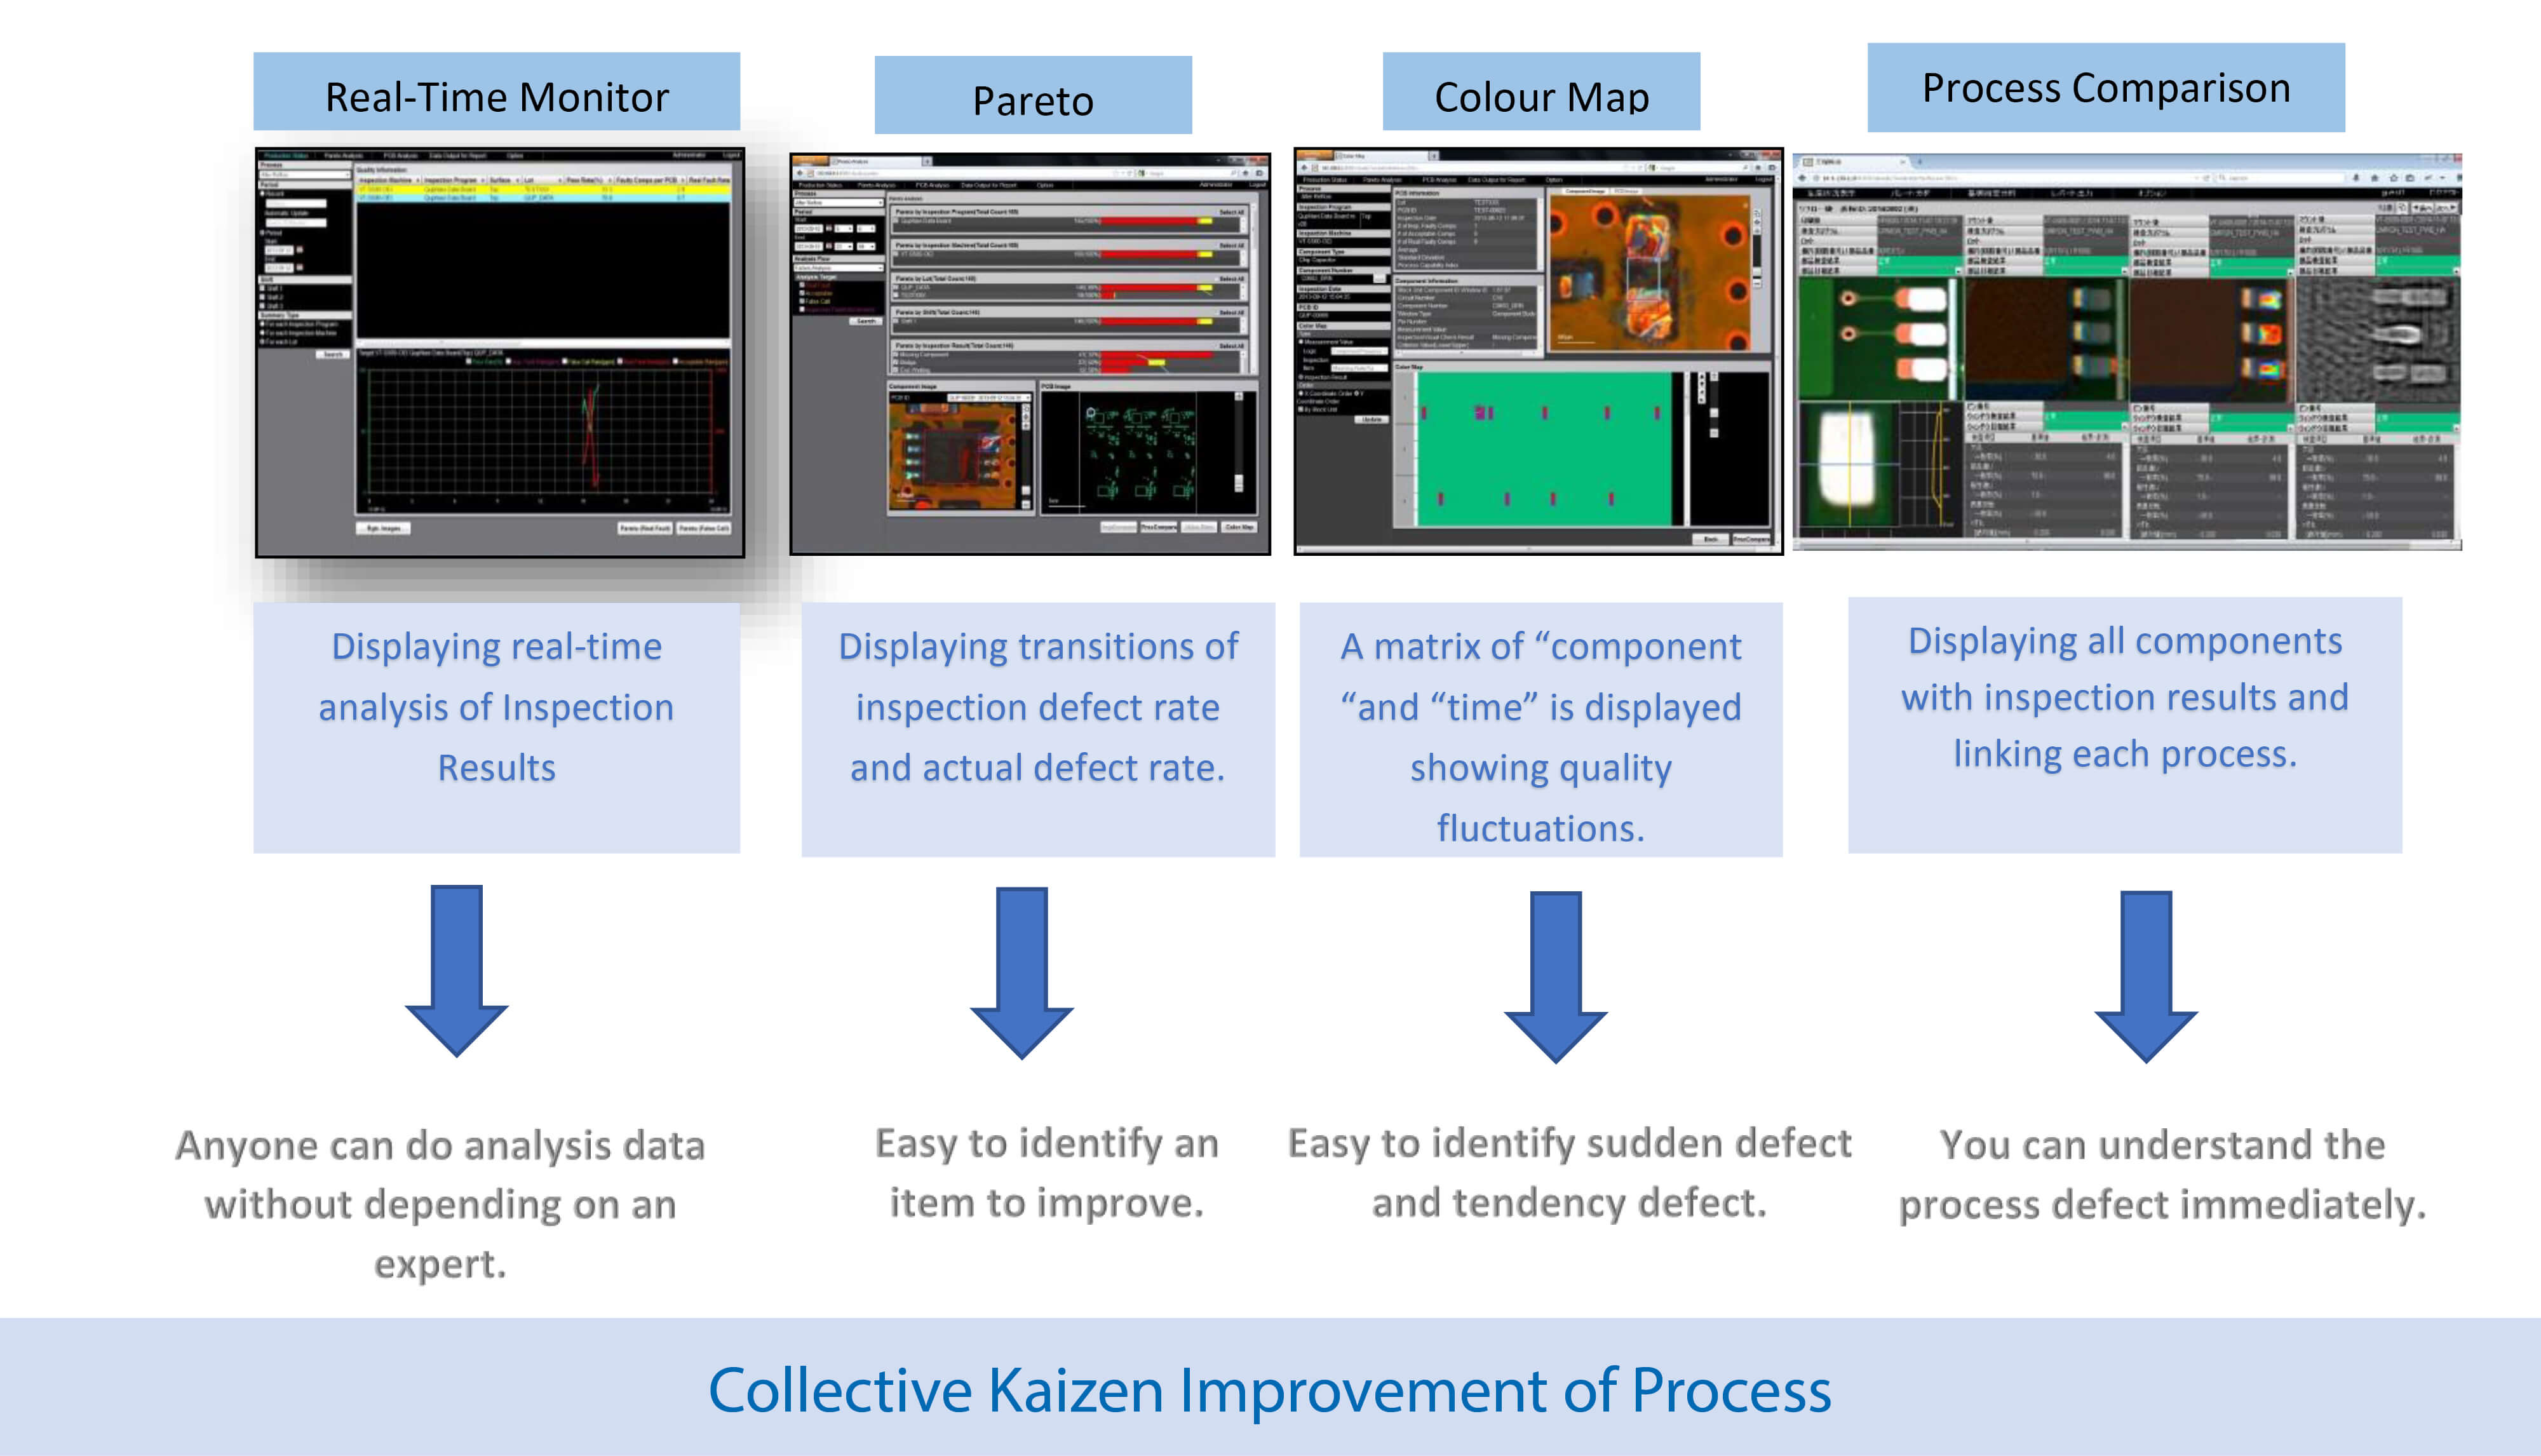
Features
The information provided by Q-upNavi results in number of outcomes:
- Navigates Engineers and Operators in locating all Process Defects.
- Quick Result Feedback of Manufacturing Process Changes.
- Quality Analysis of Process Defects, supported by High Quality Color Images.
- Stabilise your Process providing Achievable Process Target’s to 99% FPY.
- Real Time SMT Process Monitoring, with coverage of all Production Lines.
- Reduction in AOI Optimisation and Verification.
- Reduction in Material Waste.
Videos
-
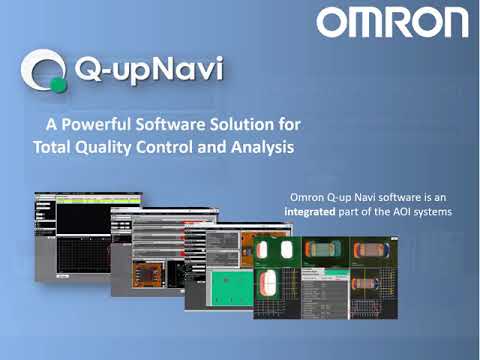
Q-up Navi software - Shift from Inspecting to Improving
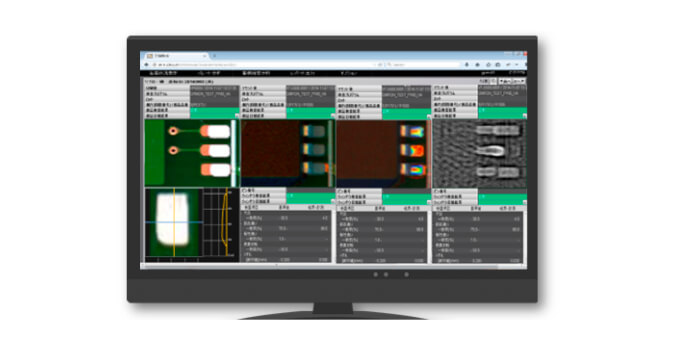
Q-upNAVI is designed with the Process Engineer in mind, providing High Level Statistical Analysis supported by High Quality Color Imagery of your Process. Data is collected from any of Omron’s SPI, AOI and AXI Systems that’s presented in a format for Easy Process Diagnosis for Engineers and Operators.
01:32